
Reference architecture
OpenBao Observability
Use this site to understand OpenBao observability, run the local validation profile, adopt generated artifacts, read dashboards, and respond to alerts.
The architecture starts from verified OpenBao behavior and source contracts, then publishes a tested Prometheus, Loki, Grafana, and Grafana Alloy profile that you can adapt to your own monitoring and logging platform.
Workflow
Read in the order you operate
- 01
Understand the architecture
Start with the signal layers, trust boundaries, and portable decisions that stay stable across monitoring and logging platforms.
- 02
Run the local profile
Use Docker Compose to inspect generated dashboards, alerts, logs, and fixture scenarios against a local OpenBao HA cluster.
- 03
Adopt the signals
Map metrics, logs, audit logs, labels, dashboards, alerts, and runbooks into your own observability platform.
- 04
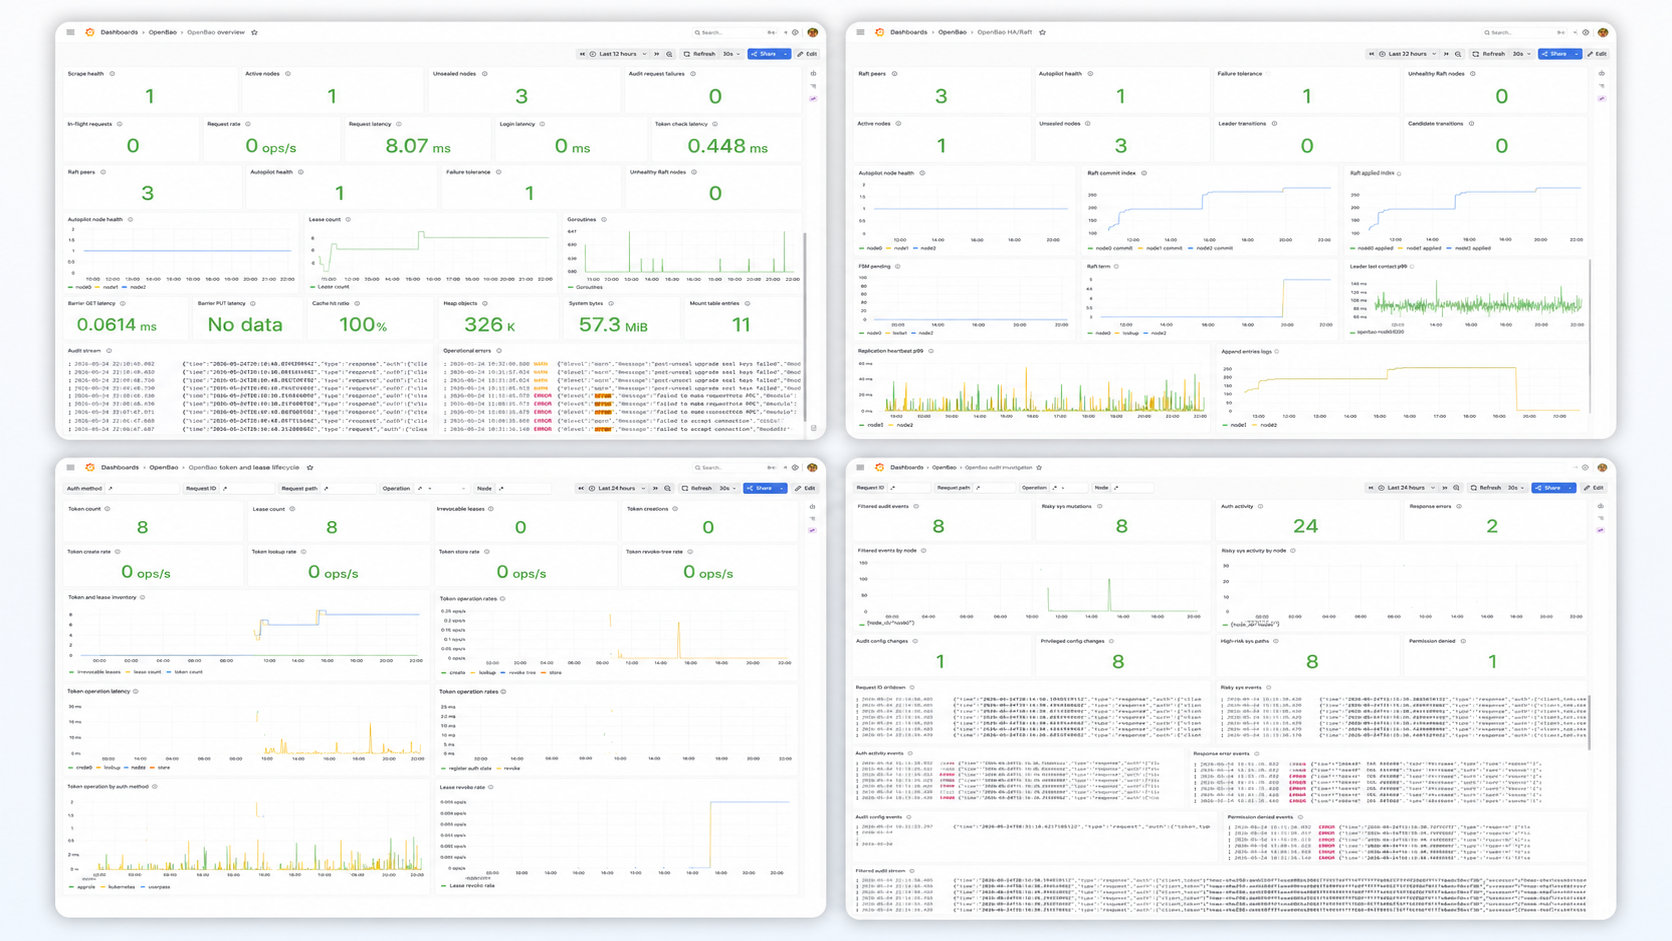
Read the dashboards
Use dashboard docs to understand what each generated panel asks, what data it needs, and where to drill down next.
- 05
Respond to alerts
Follow runbooks for scrape failures, sealed nodes, HA/Raft problems, audit failures, security detections, and SLO burn.
Sections
Documentation map
Reference
Signals, safety, and operations
Metric behavior, scrape profiles, compatibility, recording rules, and derived OpenBao signals.
AuditAudit devices, audit logs, canary checks, archive health, and security-record handling.
Operator profileCompanion guidance for using this reference architecture with operator-managed OpenBao clusters.